Space Data
A space physics research lab for talented middle and high schoolers who explore phenomena through data
In-person in Princeton, NJ · or hybrid from anywhere
The Opportunity
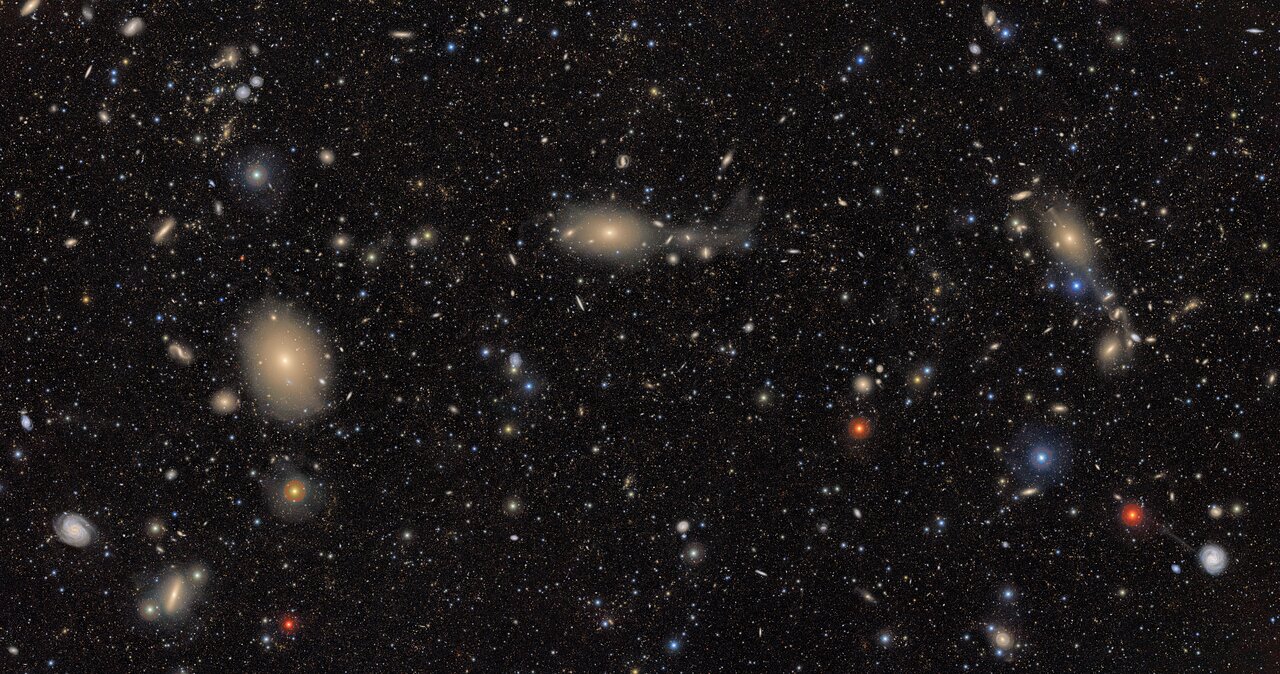
In this lab you do astronomy the way a large share of modern astrophysics is done: from data. The telescopes are already built and what they record is public. You query an archive, write the analysis, and defend a measurement of a real object in the sky, taken by an instrument you never touched. The questions are physics: what is this object, how does it move, why does it change.
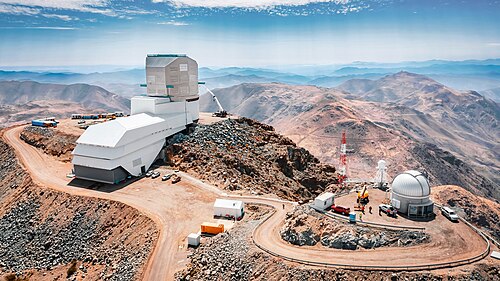
Astronomy measures faster than it can look. A single new survey telescope expects to record about 10 terabytes of sky images and issue millions of alerts every night. Whole-sky maps carry positions and brightness for almost two billion sources, and a digitized century of photographic plates holds tens of billions of measurements more. The archives run deeper than anyone has looked: of the roughly 341,000 entries in the asteroid light-curve database, only about 31,000 carry a rotation period reliable enough for statistical work.
Space Data is one of the SoTS Research Labs, which follow the same methodology and format: see Princeton Labs for how semesters work and expectations from students participating in the program.
Recent Work in This Field
This field is active. Recent work covers the spin of asteroids, a century of starlight on photographic plates, star clusters coming apart, planetary surfaces that still move, the crowding of Earth orbit, and the sky seen from the ground.
Recent publications
The spin of asteroids
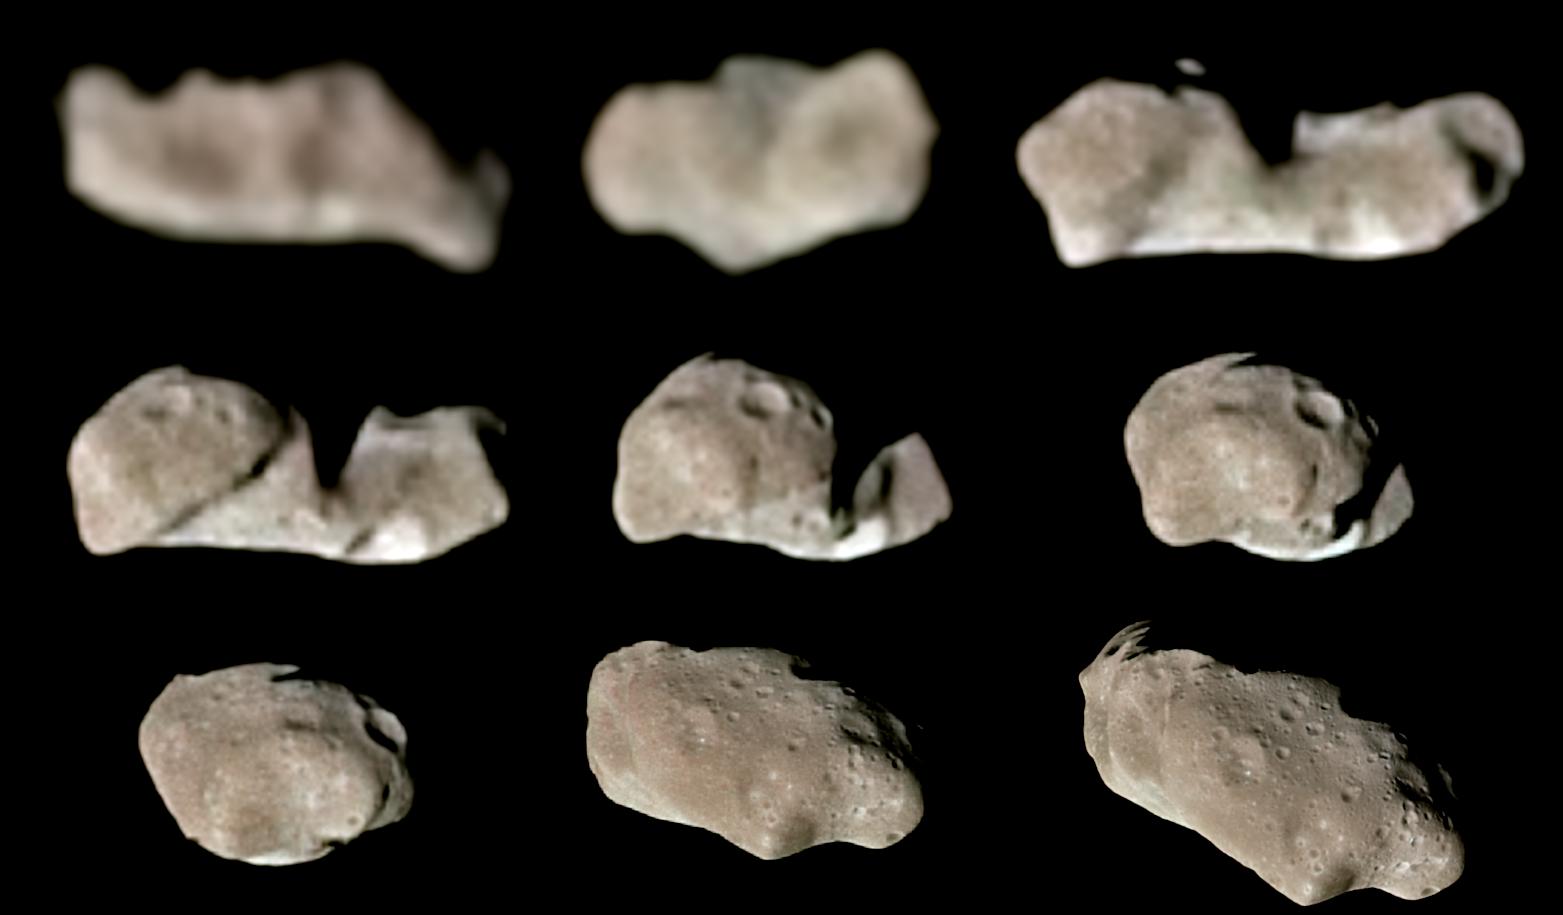
- Gaia's third data release carries photometry for over 150,000 asteroids; from it, researchers reconstructed unique spin states and low-resolution shape models for about 8,600 (Ďurech & Hanuš, 2023).
- A 2024 study derived asteroid rotation periods by combining a ground survey with a space telescope, and quantified how often survey-derived periods come out unreliable (Gowanlock et al., 2024).
- The Minor Planet Bulletin publishes new rotation period measurements. One recent paper reported light curves of 22 asteroids (Stone, 2025). Another in the same issue, with a high school student as first author, measured the period of asteroid 4222 Nancita with a 13-centimeter telescope (Chen et al., 2025).
A century of starlight
- One astronomer measured the star KIC 8462852 (“Tabby's star”) fading by about 0.16 magnitudes per century across the Harvard plates (Schaefer, 2016).
- Another team found that at that level the plates themselves can drift, and that the apparent fading tracks systematic effects in the archive (Hippke et al., 2016).
- A search of a single patch of sky in the plate archive found three giant stars swinging by a full magnitude over decades. They resemble no reported class of variable star, and no model explains them (Tang et al., 2010).
- The completed DASCH digitization was released in 2024, with a documented Python package for pulling any star's light curve (Williams, 2025).
Star clusters in Gaia
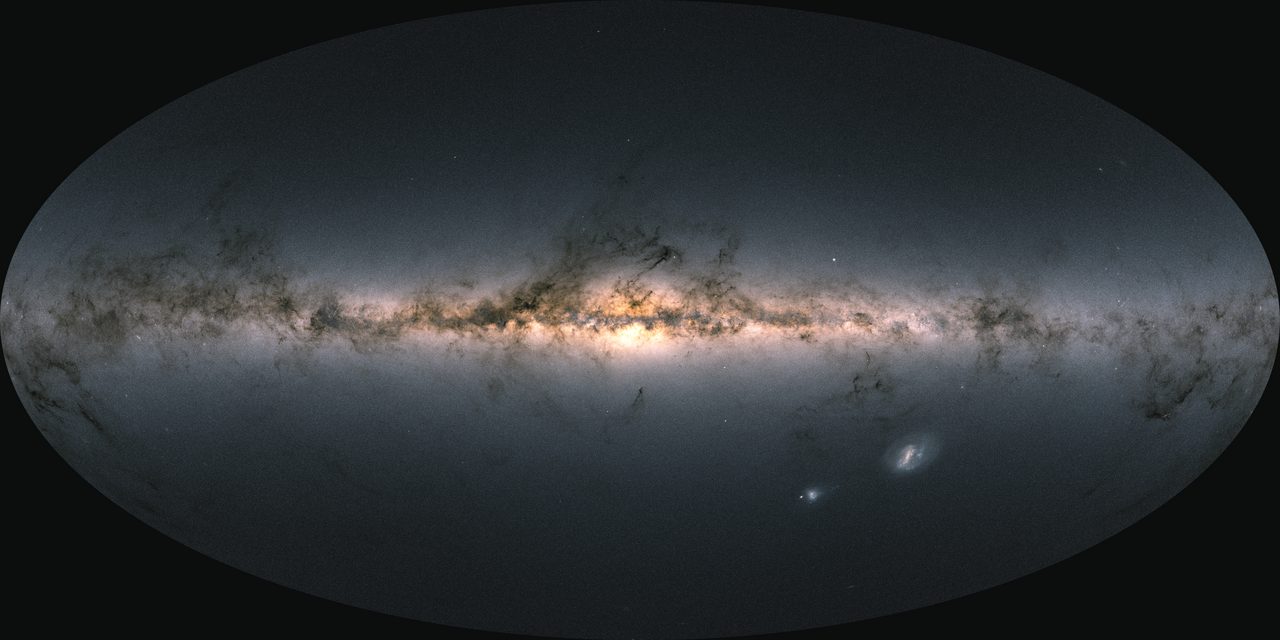
- An all-sky census built from Gaia's third data release recovered 7,167 star clusters, 2,387 of them candidate new objects (Hunt & Reffert, 2023).
- Another study showed that dozens of “clusters” that sat in catalogs for decades are chance alignments of unrelated stars (Cantat-Gaudin & Anders, 2020).
- Gaia astrometry revealed 800-parsec-long tidal tails around the Hyades (Jerabkova et al., 2021), and tails around Praesepe as well (Röser & Schilbach, 2019).
Surfaces that still move
- When experts counted craters on the same lunar images, their totals varied by up to about 45 percent (Robbins et al., 2014), a spread that matters because crater counts are how planetary surfaces are dated.
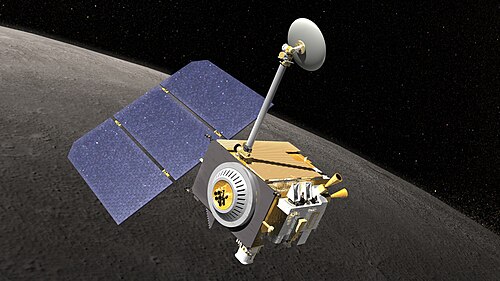
- A machine-learning sweep of Lunar Reconnaissance Orbiter imagery mapped 136,610 rockfalls across the Moon (Bickel et al., 2020).
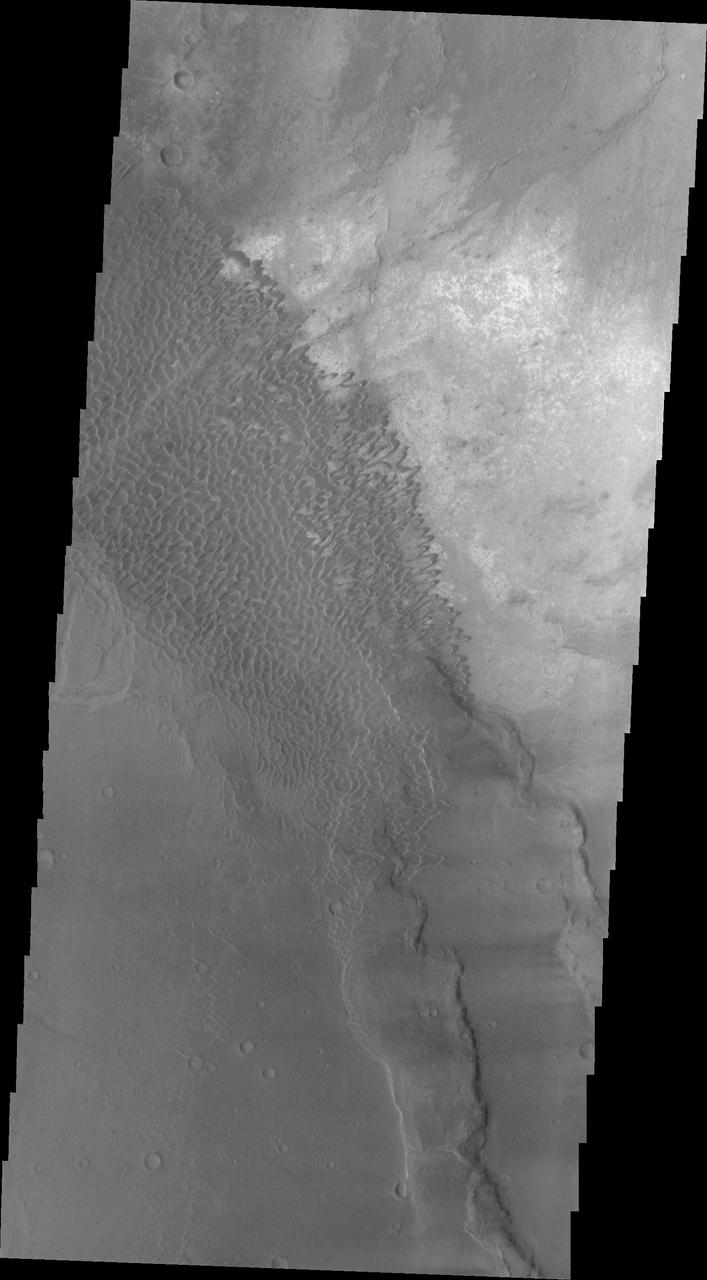
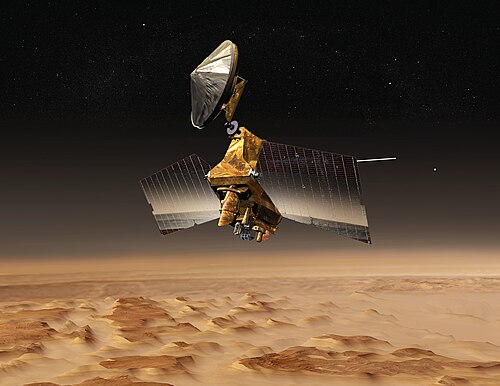
- Repeat orbital image pairs showed megaripples migrating at two Martian sites (Silvestro et al., 2020).
- Dust devil motion, measured across orbital images, revealed near-surface winds on Mars stronger than atmospheric models predicted (Bickel et al., 2025).
Objects in Earth orbit
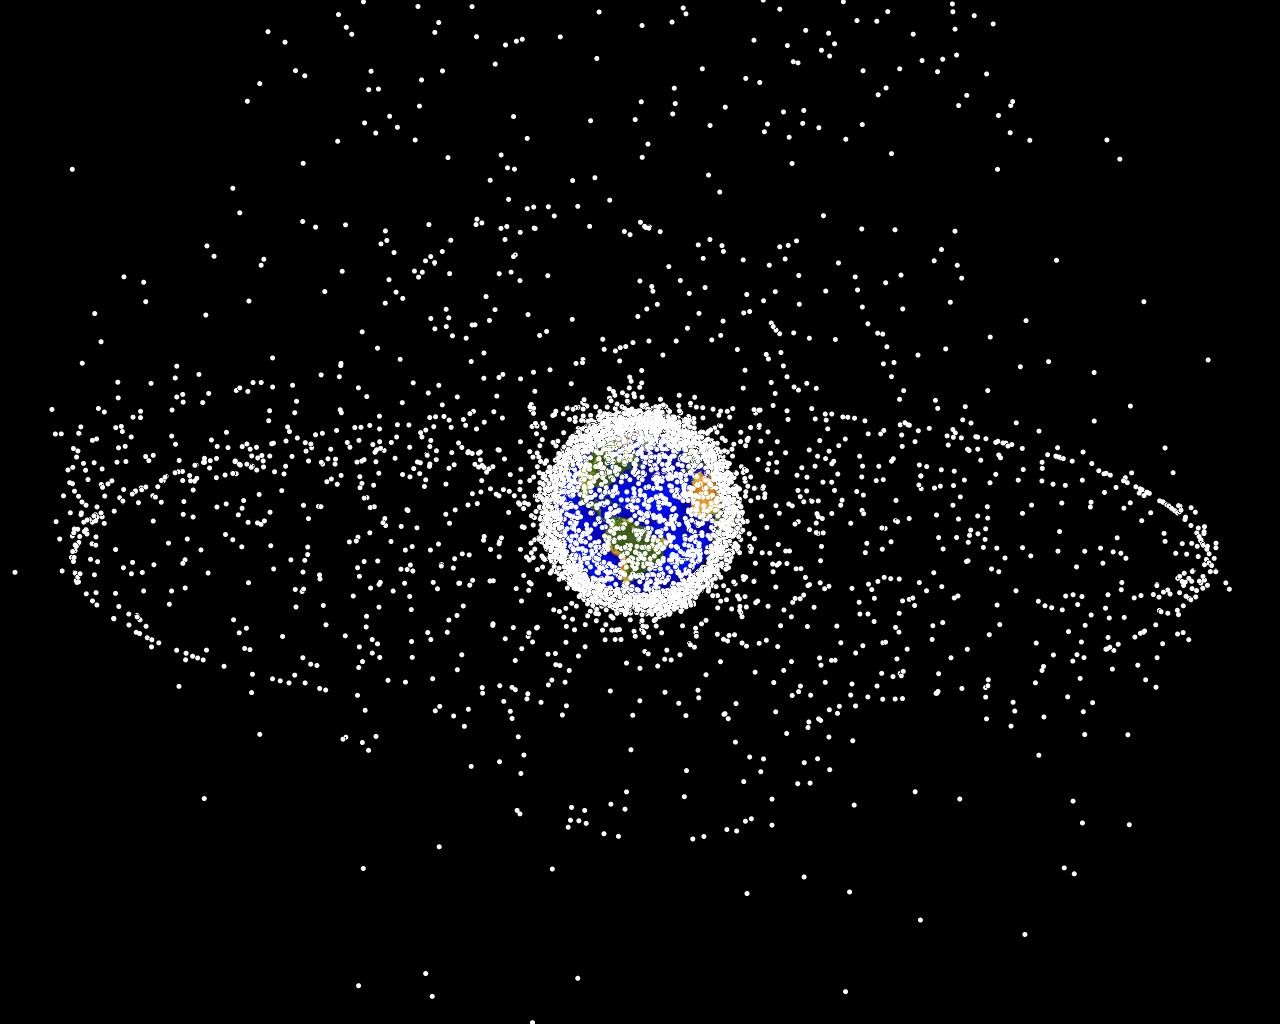
- At its August 2024 reference epoch, ESA estimated 54,000 objects larger than 10 centimeters in orbit, about 9,300 of them active payloads, alongside 1.2 million between 1 and 10 centimeters and 130 million from 1 millimeter to 1 centimeter (ESA Space Environment Report, 2026). In low orbit they meet at about 10 kilometers per second, fast enough that a centimeter-wide chip is dangerous.
- Two events account for much of the debris: the 2007 destruction of the 880-kilogram Fengyun-1C satellite in a weapons test left about 1,800 cataloged fragments (Pardini & Anselmo, 2007), and the 2009 Iridium-Cosmos event, the first collision of two intact satellites, left 1,632 cataloged fragments (Wang, 2010).
- A satellite's orbit decays through atmospheric drag, and the drag rises when solar activity heats the upper atmosphere. Tracking 523 Starlink reentries from 2020 to 2024 in the public orbital catalog, one study found they fell faster during geomagnetic storms (Oliveira et al., 2025).
- Reentering spacecraft vaporize high in the atmosphere. About 10 percent of stratospheric aerosol particles now carry metals from them, and for aluminum the human-made input already rivals the natural dust that meteors supply (Murphy et al., 2023).
- Bright satellites also cross astronomers' images. Photometry of more than 100,000 Starlink magnitudes characterized the original design and VisorSat, which adds a Sun shade to make the satellites fainter (Mallama, 2021).
The sky from the ground
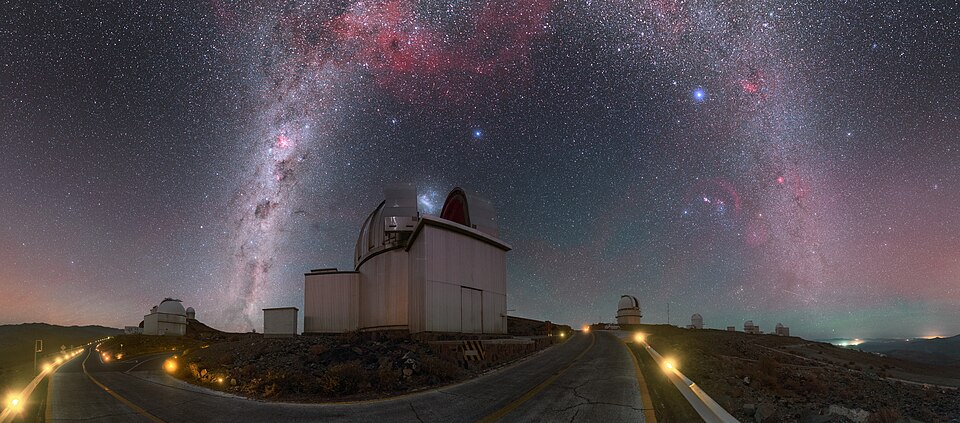
- About 83 percent of the world's population lives under light-polluted skies, and the Milky Way is hidden from more than a third of humanity (Falchi et al., 2016).
- It is changing fast. Naked-eye reports from 51,351 citizen observers put the sky brightening at about 9.6 percent a year from 2011 to 2022, enough to take a location from 250 visible stars to about 100 across a childhood (Kyba et al., 2023).
- Satellites see the ground brightening at only about 2.2 percent a year, and reconciling that with the naked-eye rate is unsettled: the gap traces to the shift toward blue LED light and to sources satellites cannot see (Bará & Castro-Torres, 2025).
- Amateurs supply the data. Globe at Night collects naked-eye star counts worldwide, and the Global Meteor Network has recorded more than 220,000 meteor orbits from over 450 low-cost cameras across 30 countries (Vida et al., 2021).
The Archives
The data behind all of this is public. Among the archives this lab works from:
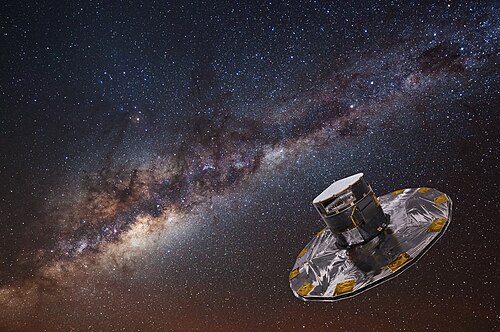
- Gaia Archive (ESA): positions and brightness for 1.8 billion sources, with proper motions for 1.46 billion.
- DASCH (Harvard): a digitized century of photographic plates, the 1880s to 1992.
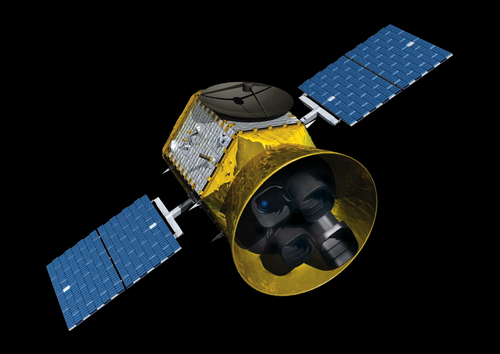
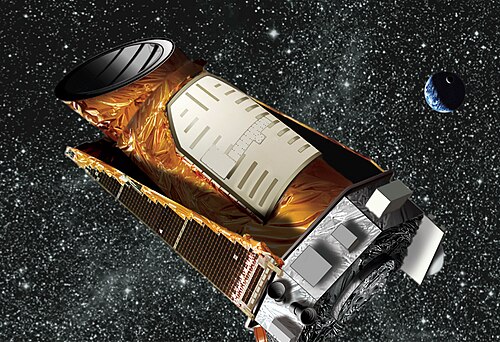
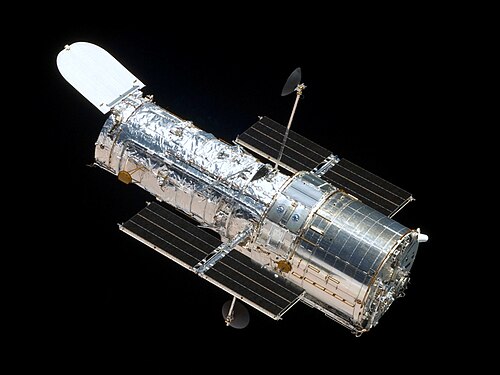
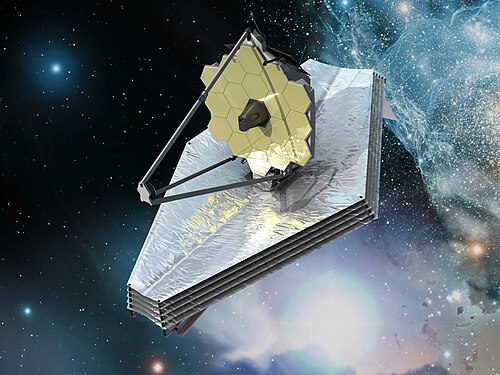
- MAST (NASA): space telescope data, including the Hubble and JWST archives and the TESS and Kepler light curves.
- ALCDEF and the LCDB: asteroid light curves, and the database of rotation periods with quality ratings.
- ZTF: public data releases from a repeating survey of the northern sky.
- LROC and HiRISE: high-resolution imagery of the Moon and Mars, including repeat coverage of the same ground.
- CelesTrak: free orbital element sets and the satellite catalog for tracked objects in Earth orbit.
- Globe at Night and the Global Meteor Network:citizen naked-eye sky-brightness reports, and meteor orbits from amateur cameras.
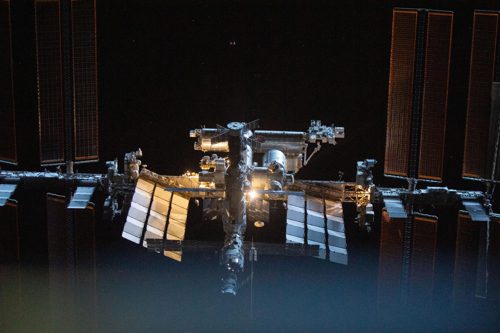
- NASA Physical Sciences Informatics: data from physics experiments run on the ISS, open for reanalysis.
Prerequisites
Open to high school, middle school, and home school students who like exploring phenomena through data. No prior research experience, astronomy background, or telescope is required.
Full requirements
- Statistics makes sense to you
- Experience in a computational language (Python, R, MATLAB, Wolfram, or similar) is welcome but not required
- Curious about why objects in the sky behave the way they do, not just how they look
- Willing to read into a real literature and design your own study, not follow pre-made assignments
- Commitment to weekly meetings and work between sessions
Enrollment and Tuition
Tuition
- $3,500per semester
- Formats
- In-person in Princeton, NJ, or hybrid from anywhere
- Semesters
- Fall, Spring, and Summer
Same rate in every semester. See Princeton Labs enrollment for the schedule, the refund policy, and hybrid eligibility.